Iguana Solutions is an IT infrastructure hosting and outsourcing expert that needs to know in real time the state of all the infrastructures under its control.
The continuous evolution of the various software layers, the arrival of new development practices such as containerization, new agile development tools and DevOps practices are generating more and more data to be collected and centralized, so as to act and react ever more rapidly. The implementation of observability is the solution adopted by our technical teams to carry out their missions successfully.
Observability: Definition
Observability is the ability to observe the behavior of a system. To achieve this, the system must be instrumented on the following 3 pillars:
Metrics: Measures the state of the platform and its services. More precisely, metrics are quantified elements measured at a given point in time and at a regular frequency, making it possible to plot evolution curves over time.
Logs: text files containing all application status information: new connections, error messages, messages for developers. Application logs are useful for investigating root causes of incidents, as a complement to metrics.
Traces: Horizontal tracking of a request across several applications. Useful for understanding an application’s behavior and improving it.
Another term often used in this context is “monitoring”. Monitoring is the action of following the behavior of a system.
It should be noted that setting up application trace collection is intrusive and can have a significant impact on performance.
In a nutshell:
– Observability: the concept of observing application behavior through 3 elements: metrics, logs and application traces.
– Supervision: the action of monitoring and, if necessary, alerting on the abnormal behavior of an application or system.
Observability: Implementation
In 2018, our historical supervision system based on Naemon and Graphite was beginning to show some limitations and, above all, no longer covered all our needs to guarantee an optimal level of service for us and our customers. The stack was becoming outdated, and any modifications to include new platforms were complex. In addition, our system only monitored the “system” metrics of the equipment.
For these reasons, we decided to implement a new metrology solution with the following specifications:
- Collect hardware metrics
- Collect system metrics (system view of resources: CPU, RAM, storage, network)
- Collect service metrics required by applications (nginx, apache, php, mysql, mongoDB, elasticsearch, Docker, Kubernetes, …)
- Collect system logs
- Collect service logs
- Control the quantity and/or cardinality of each metric
- Multi-tenant system (client isolation)
- Visualization interface for us and our customers
- Very long metrics retention, unlimited if possible
The “Application traces” section is not part of the specifications, as application traces collect information directly from the source code of the applications we host.
Like a PaaS (Platform as a Service) service, through outsourcing we provide platforms specific to our customers’ needs. A platform groups together the infrastructure layer, the system part (OS + application services) and all the observability of the Infrastructure + System package. The software part (application code) remains the responsibility of our customers. However, on request, as part of an investigation or for optimization purposes, we can offer to deploy an application trace collection tool to optimize the operation of the entire platform.
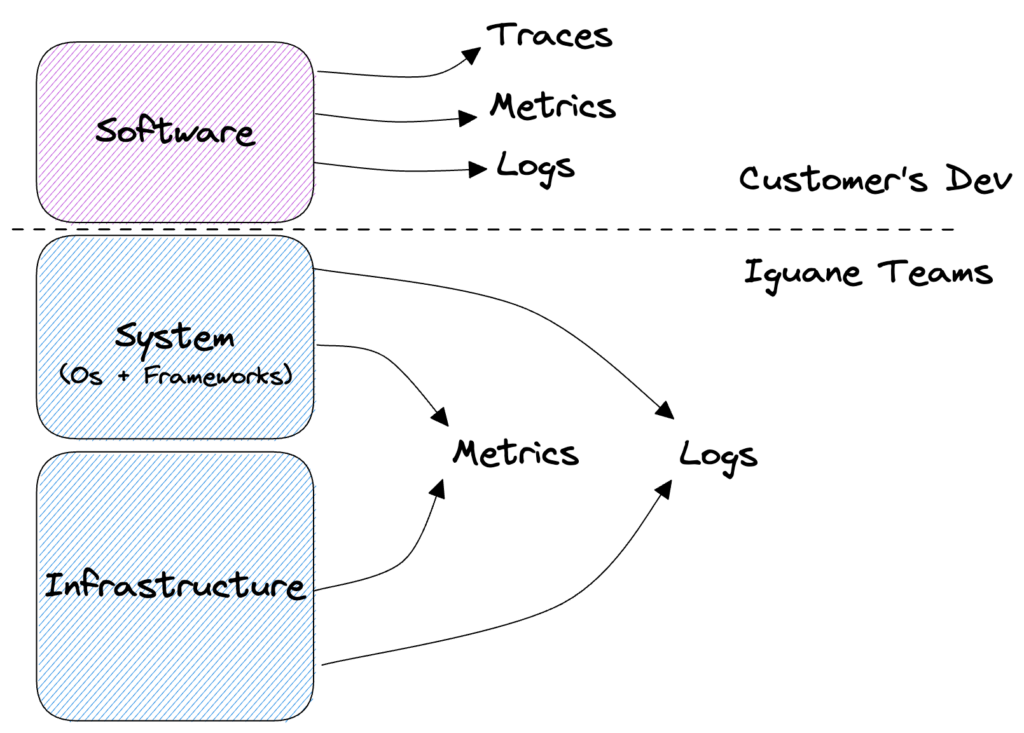
Figure: Representation of the different layers of a software application with their respective observability elements.
Based on the previous specifications, we had 2 options:
- Use a market observability tool like Datadog, Dynatrace, Splunk for example
- Rely on a set of Open Source tools such as Prometheus, VictoriaMetrics, InfluxDB, Grafana and develop the parts we’re missing.
After a quick study, we arrived at the following comparative table:
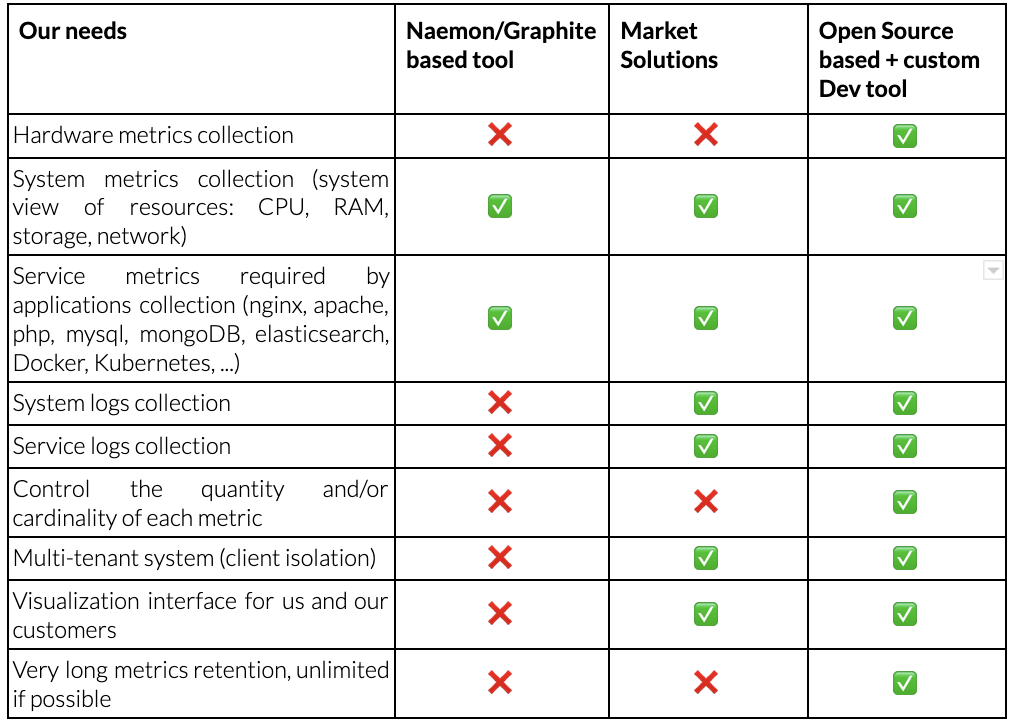
The “Open Source + Dev-based tool” column wins the vote as the most malleable option. In-house developments enable us to add requirements not present in open source solutions:
- Link the selected software,
- Secure exchanges (TLS set-up between each component)
- Isolate clients.
- Have our own agent to collect metrics and logs
This combination of Open Source solutions and in-house developments is the only one that really meets our needs in terms of modularity, integration of hardware metrics, long retention time and lower total cost than a SaaS solution on the market.
This option also gives us complete control over the information processing chain, from generation to processing and storage.
This in-house project is called Sismology.
Architecture and operation of Sismology
Sismology’s architecture and operating logic remain very simple:
- Metrics and logs collection agent on all equipment
- 2 appliances (redundancy required) per customer organization: servers with Prometheus (metrics collection) and Fluentd (log collection)
- Victoria Metrics cluster (centralization of all metrics with customer identification for isolation) and Loki (centralization of logs)
- Within the Victoria metrics cluster we have developed 2 services to support the automatic and secure management of client isolation:
- Sismology Ingester: which inserts metrics for a given client based on the client’s Sismology appliance IDs.
- Seismology Selecter: does the same to select the right metrics for the visualization interface.
- Visualization via Grafana dashboards with management by customer organization
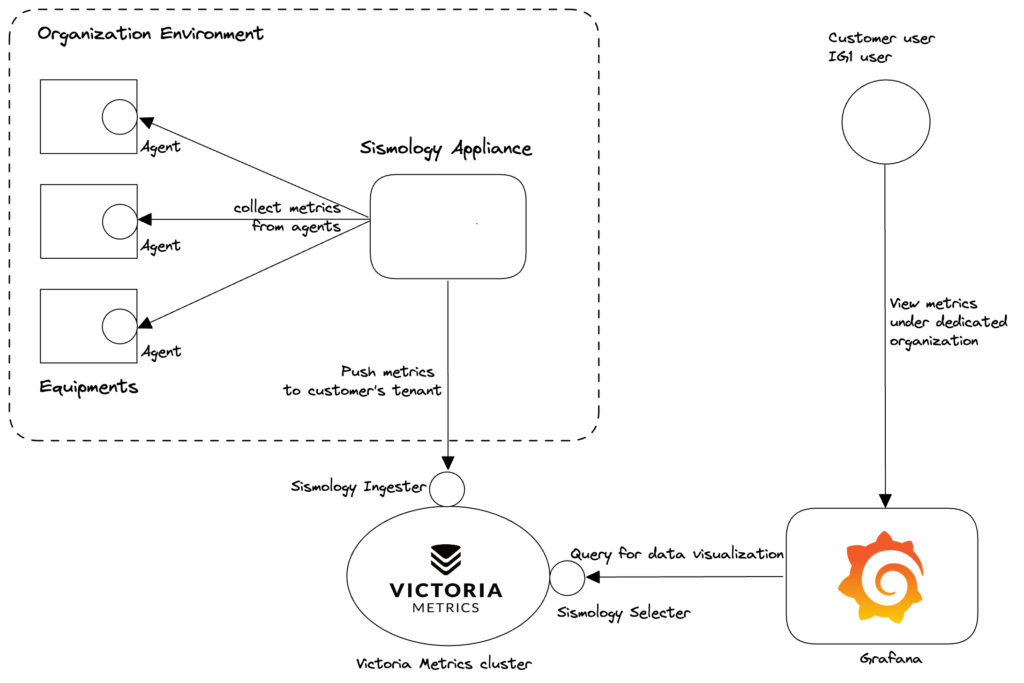
Figure: Metrics flow diagram from equipments to visualization through collection
For metrics collection, we have developed a set of plugins adapted to each type of service measured: system, hardware, mysql, php, apache, etc. Each agent activates the necessary plugins only on the basis of the services configured on the device.
To centralize metrics, we initially chose to use InfluxDB as a tool for aggregating metric points. However, we were soon faced with performance issues that deteriorated with the addition of new equipment.
After a little research and a few more benchmarks, we chose VictoriaMetrics for its point aggregation, its compatibility with Grafana and the possibility of deploying it in a “High Availability” cluster in its OpenSource version. What’s more, VictoriaMetrics boasts excellent data deduplication and compression capabilities that improve over time: the more data there is, the better the compression without degrading performance. In addition, VictoriaMetrics enables easy management of different organizations, and thus clean data isolation. Finally, VictoriaMetrics integrates perfectly with Grafana, so redesigning our visualization dashboards was not a complex task.
More technical details on our use of VictoriaMetrics: https://medium.com/iguanesolutions/sismology-iguana-solutions-monitoring-system-f46e4170447f
For the Logs section, we developed our log collection and centralization tool around Fluentd (collection) and Loki (centralization). Loki is a tool developed by Grafana Labs and integrates perfectly with Grafana to facilitate log visualization and navigation.
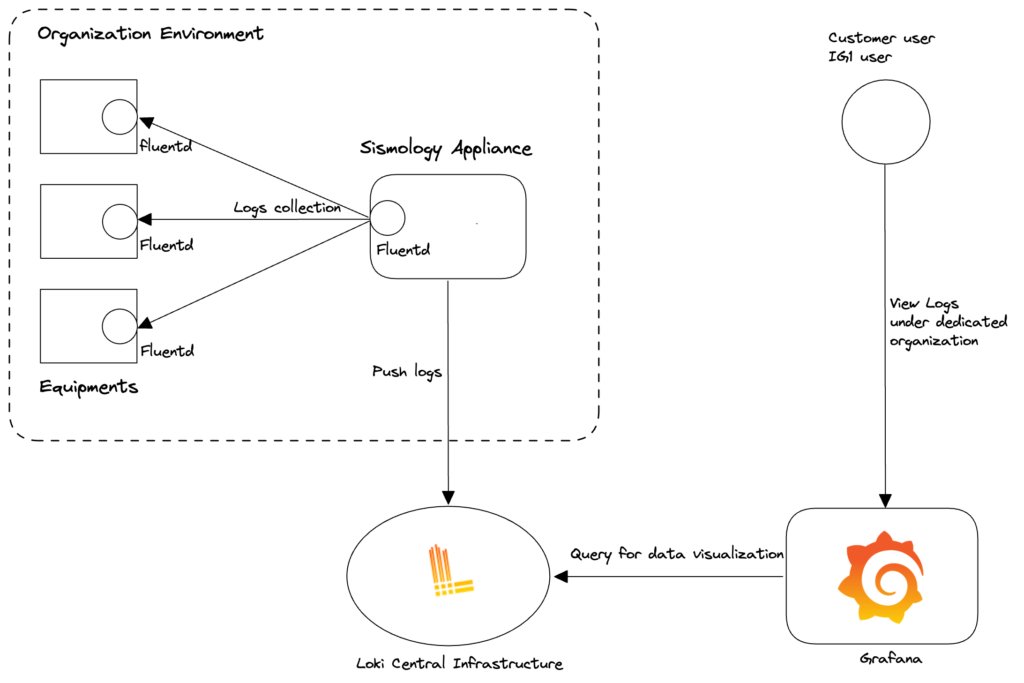
Figure: Log flow diagram between equipment, collection, storage and visualization
This last point is very important, as it facilitates investigation in the event of an abnormal event. On the same Grafana Dashboard, you can view the metrics and logs of a system over a given period.
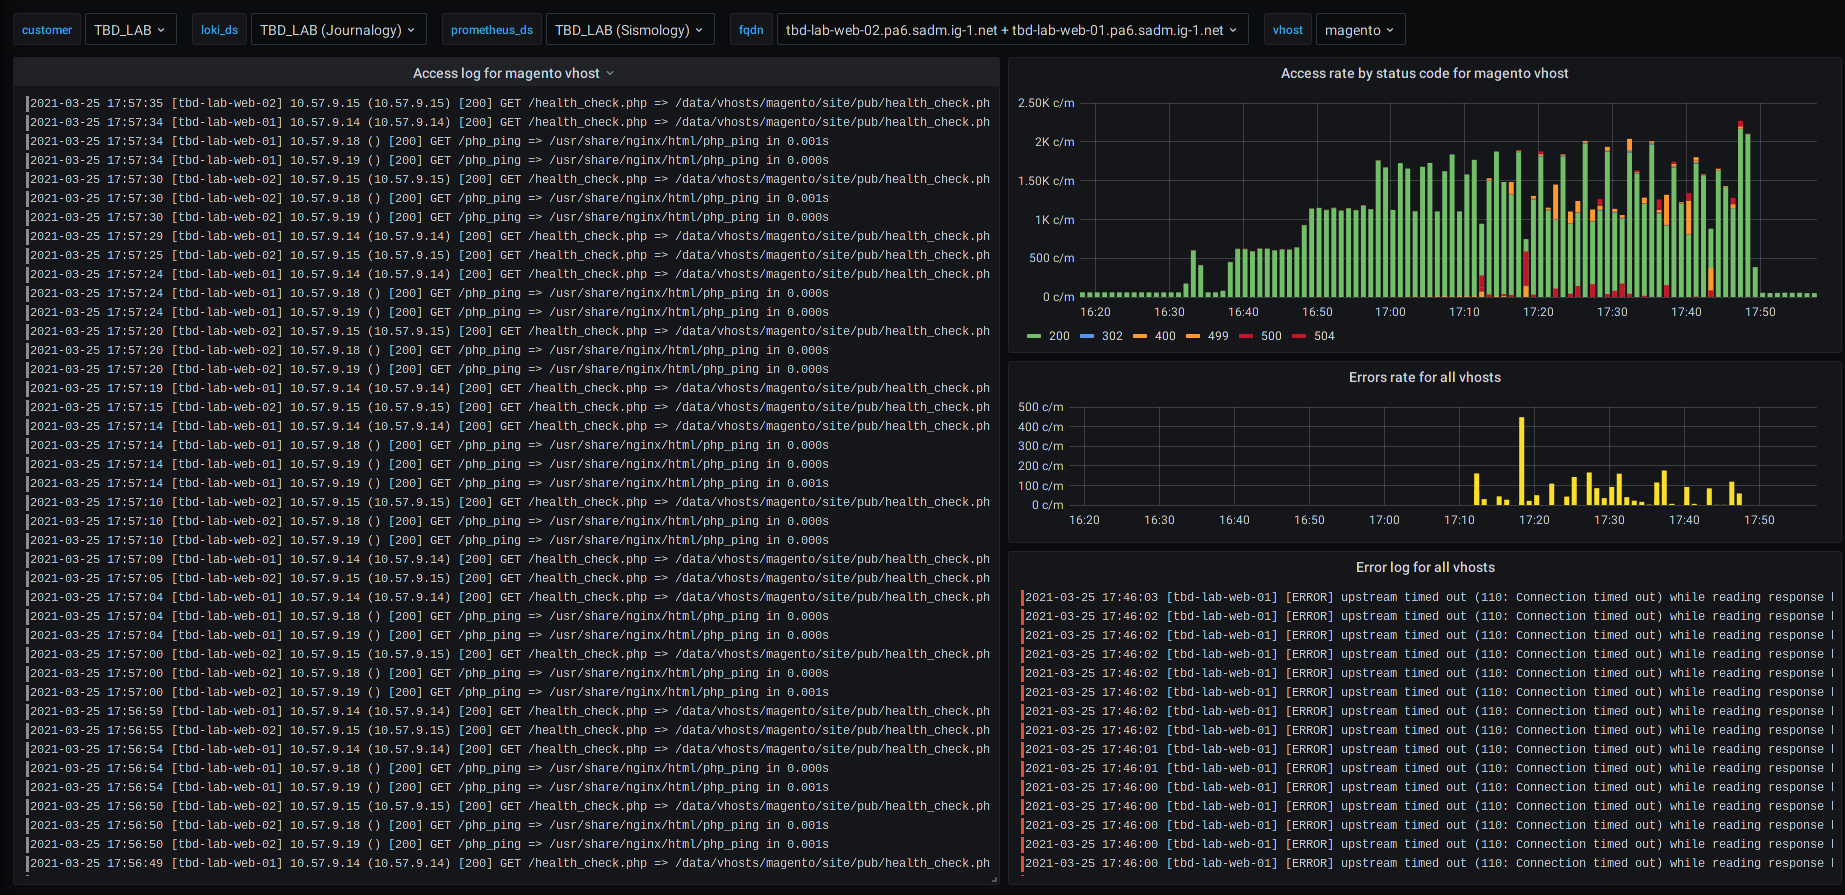 Figure: Examples of different service dashboards for an e-commerce site (based on Magento)
For example, in the event of an HTTP error on a web server, you can view the progress of the error and the corresponding logs on the same screen.
Our Support and Expert teams save precious time in the event of an abnormal event or incident.
Our benefits
We have a modular, secure solution for collecting and centralizing metrics and logs from all platforms. Thanks to this data, we were able to develop an effective supervision tool.
This alert management tool, directly integrated with Sismology, enables us to trigger support or on-call at any time, according to criteria defined by our DevOps experts. Our alert manager is connected to PagerDuty (triggering support) as well as to Slack, where we receive real-time notifications of all alerts on all platforms. This means we can react immediately, whatever the nature of the alert, and resolve any anomaly as quickly as possible.
The implementation of preventive incident detection and the addition of hardware problem detection by Seismology have considerably reduced their impact on customer systems, which in turn has improved our SLAs.
Conclusion
Observability is a critical component of any IT platform supervision solution. For us, it lies at the very heart of our business, and requires the implementation of a reliable, efficient solution tailored to our needs.
Our metrology tool therefore focuses on 2 of the 3 pillars of observability: metrics and logs.
With Sismology, we have a tool that is simple, effective and easy to maintain, with only the bare essentials to keep it as simple as possible. All our technical teams contribute to the evolution of the tool by regularly adding new plugins to support a new framework or to evolve the collection of an existing service. After more than 4 years of use, we have tested a large number of use cases, and we offer our customers dashboards that enable them to easily monitor the behavior of their platforms.
To remember:
- Observability: 3 axes for observing application behavior: metrics, logs, application traces
- Supervision: action of monitoring platform behavior based on observability
- Implementation requires the deployment of tools:
- either “turnkey” tools with a wide range of integrations : Datadog, Dynatrace, Splunk …
- or tried-and-tested Open Source tools, with development work required to adapt them: Prometheus, VictoriaMetrics, Fluentd, Grafana…
- Sismology: Iguane Solutions’ metrology solution, which focuses on the essential metrics and logs for the customer platforms to be monitored.